Managing and Editing Timeline Charts
From within a canvas plan, you can quickly perform the following tasks by clicking the relevant icon on a chart's tile.
![]()
-
View the chart (view mode).
-
Edit a timeline chart - opens the timeline chart in edit mode, where you can add, edit and remove initiatives, add important dates and content dates, and configure your chart settings.
-
See who has access to the chart, and copy the link or embed code of the chart.
These options, along with deleting the chart, are also available when you are viewing a chart (as highlighted below).

Edit a timeline chart
Rename the chart
Rename the chart by clicking the into the title text field (shown below) and typing the new name.

Click the Save button to save the new board name.
Update the chart settings
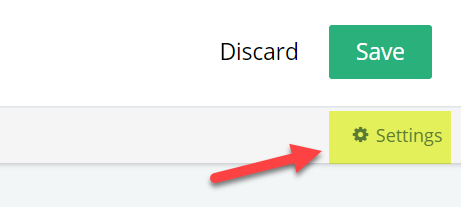
Click the Settings button to begin.
Adjust timescales
Toggle the Date scale to see a view of a week, month, or quarter on your chart within its timeline range.
Define a Custom timeline range to select the time-frame for your chart.
Enabling additional layers
The following settings allow you to display additional information for initiatives and content assets in your matrix chart.
-
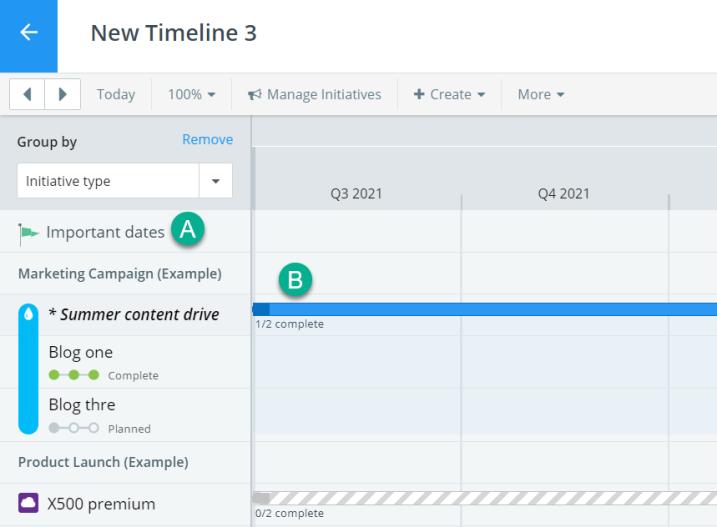
Select Important dates to allow users to view important dates in the timeline (see A below).
-
Select Status to display how many assets are complete for each initiative (see B below).
Enable content dates
Enable content dates to add custom field dates, task dates, and event dates to your timeline chart.
When they’re added to your chart, you’ll see these dates when you click on an initiative in your chart.
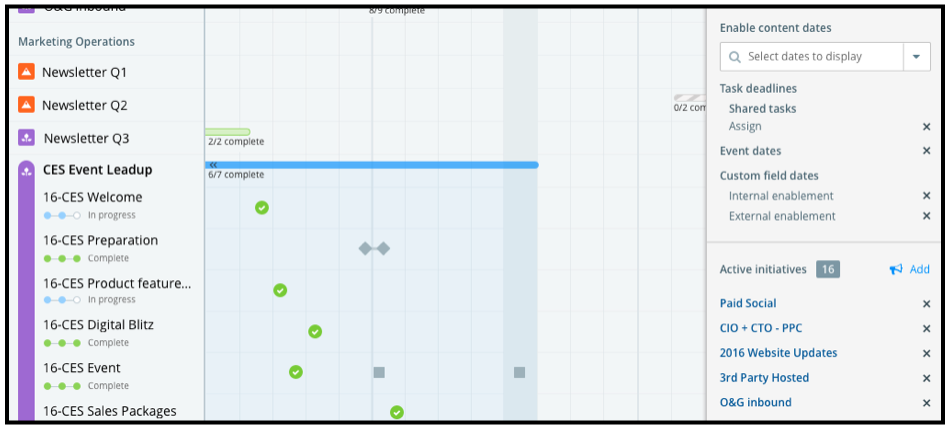
If you’d like to add all Task dates, Event dates or Custom field dates to your chart, select the relevant checkbox.
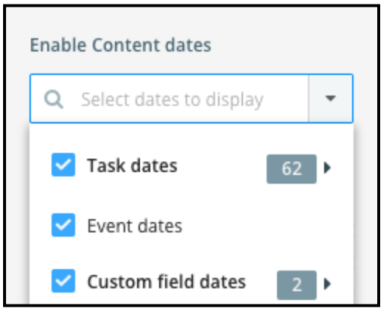
To select specific dates to surface on your chart, you can select dates individually by expanding the menus for task dates, event dates and custom field dates.
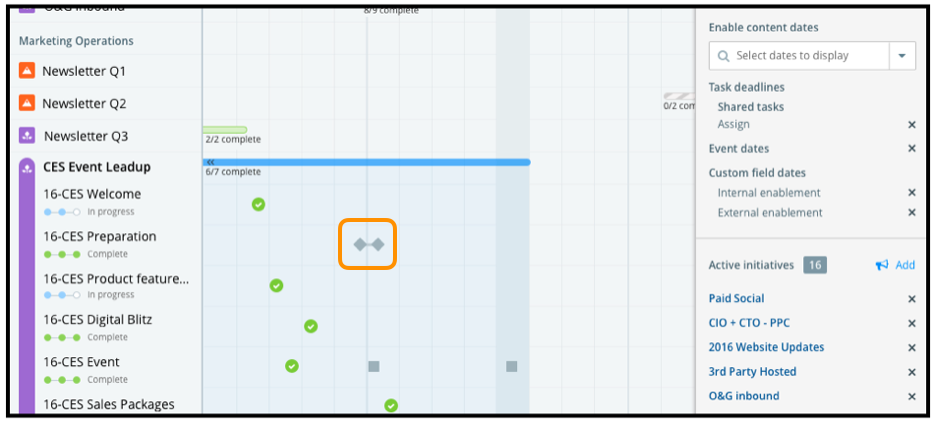
Event dates are the start and end dates on an event content type within an initiative.
These dates appear as grey diamonds on your timeline charts.
Task dates are the workflow deadlines on content. In your chart’s settings panel you can select specific workflow tasks for each content type. This lets you control which dates appear, and when some should be removed to declutter a busy timeline.
These dates appear as grey (incomplete), green (completed), and red (incomplete and overdue) circles on your timeline charts.
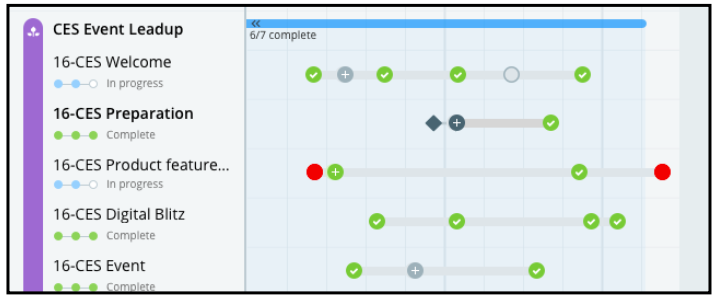
If there are dates that are close together in your timeline chart, their icon will have a plus on it to indicate that several key content dates are reflected by the icon. Click on the icon to open a list of the clustered dates.

Task dates will only appear on timeline charts on content with workflows that have task deadlines assigned. If a piece of content doesn’t have a filled-out workflow with task deadlines, task dates won’t appear on your chart.
Add Custom field dates when you’re managing dates within a custom field (not in a workflow task) on content.
These dates appear as grey squares on your timeline charts.
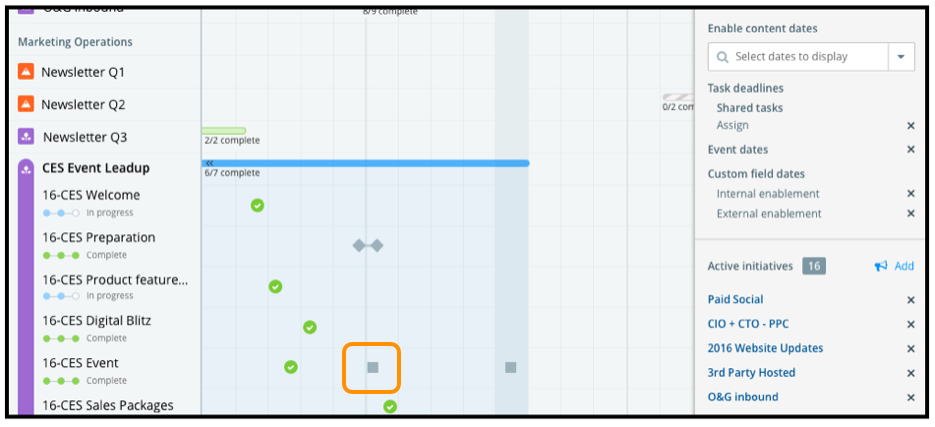
If you’re not using custom field dates in your instance—meaning if your content doesn’t have a custom field for date entry—then this option won’t appear in the drop-down menu for content dates to add to your timeline.
Active content dates are listed in the chart’s Settings panel when you’re in editing mode. You can remove any content date by clicking the X next to it.
Manage initiatives
The settings panel displays all the initiatives that are currently displayed in your timescale chart.
Click the X next an initiative to remove it from the chart.
To add an initiative, click Manage. You have two options when adding initiatives to your chart. You can set up an auto-add rule that will automatically pull initiatives into your chart based on your search criteria and/or you can search and manually add initiatives.
Edit an initiative
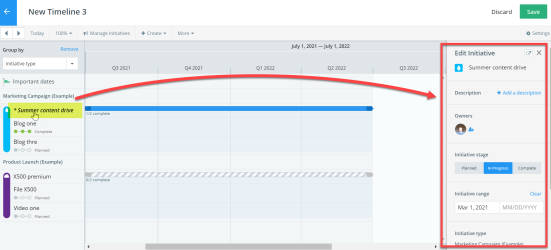
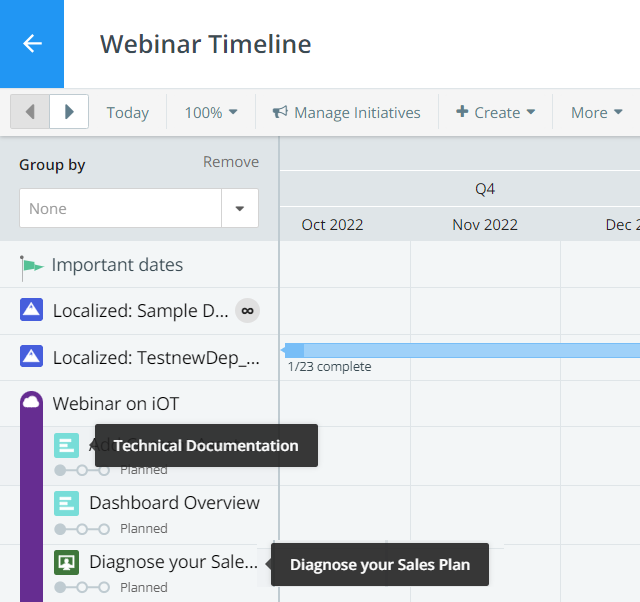
To edit an initiative in your chart, click the initiative title in the left-hand panel. The Edit Initiative panel is opened on the right-hand side - as shown below.
In this panel you can update the description, owners, initiative stage, and initiative start and end dates; these updates are reflected in the initiative in Studio.
The content associated with the initiative is also displayed in the left-hand panel. Here, you can view the title of the content and the content type icon is displayed next to the title which displays the content type name when you hover over the icon.
Creating a new initiative
To create a new initiative and that will be added to the chart and studio, click the Create button on the toolbar and select New Initiative.
The initiative is not displayed in studio until you click Save.
Adding important dates
Important dates on timelines allow you to mark key dates on your chart. These are dates you want to ensure stay top of mind as your initiatives progress, such as a product launch or a stakeholder meeting. Important dates appears as flags on your timeline charts.

To add an important date, click Create on the chart’s toolbar and select Important date. Fill out its details in the modal and click Create to add the date to your chart.
Note: Important dates that fall within a close time-frame will be grouped together.
To view and edit important dates, click on the Important dates button at the top of the left-hand column of the chart, and then click a specific date for more details and edit or delete if required.
Grouping initiatives
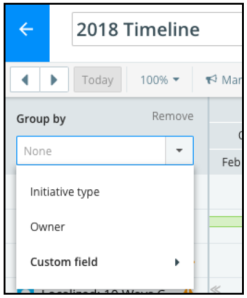
By default, the initiatives in your chart are listed to the left of your timeline alphabetically. You can group initiatives to change how they are presented to the chart user.
Use the Group by drop-down menu above your initiatives list to organize the initiatives by their type, owner, or a custom field value.
Further actions
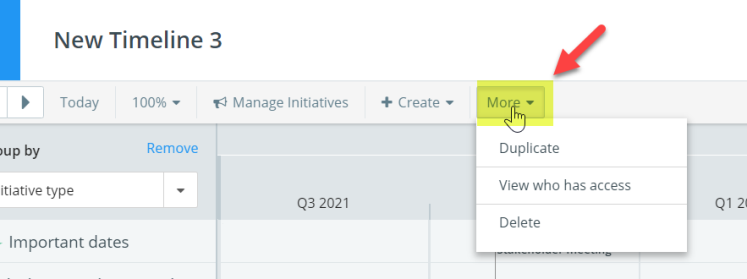
Click the More drop-down menu (shown below) to do any of the following:
-
Duplicate the chart.
-
View who has access - Shows the users who can access the chart and allows you to copy the link or embed code.
Read about using manage access functionality in canvas here to learn how to specify which members or groups can own, edit, or view plans and their associated charts, as well as how to share a plan or chart with key stakeholders (including non-Kapost users).
-
Delete the chart.
